How to Use Activity Monitor to Troubleshoot Mac Problems
Posted on
by
Kirk McElhearn

We never like to have problems with our computers, but they are inevitable. Sometimes some of your apps don’t work, your Mac gets slow, you get a spinning beachball, and more. Narrowing down the cause of such problems can be difficult; fortunately, macOS offers some troubleshooting tools you can use to diagnose what ails your computer.
One of the tools you can use to diagnose problems on a Mac is Activity Monitor, a dashboard for many of your Mac’s under-the-hood activities. In this article, I’m going to introduce you to Activity Monitor, and explain how this utility can help you find—and, in some cases, resolve—problems on your Mac.
Where is Activity Monitor on a Mac?
To find Activity Monitor on a Mac, go to your Applications folder > Utilities folder, and then double-click Activity Monitor. There you’ll see a simple app with five tabs, and a list of entries that changes every few seconds.
Each of the five tabs at the top of Activity Monitor keeps track of certain aspects of your Mac’s performance. Thy are CPU, Memory, Energy, Disk, and Network, and, if your Mac is running the content caching service, you’ll also see a Cache tab. I’ll discuss what you can see on each of these tabs and how they might be useful when diagnosing problems on a Mac.
The CPU Tab
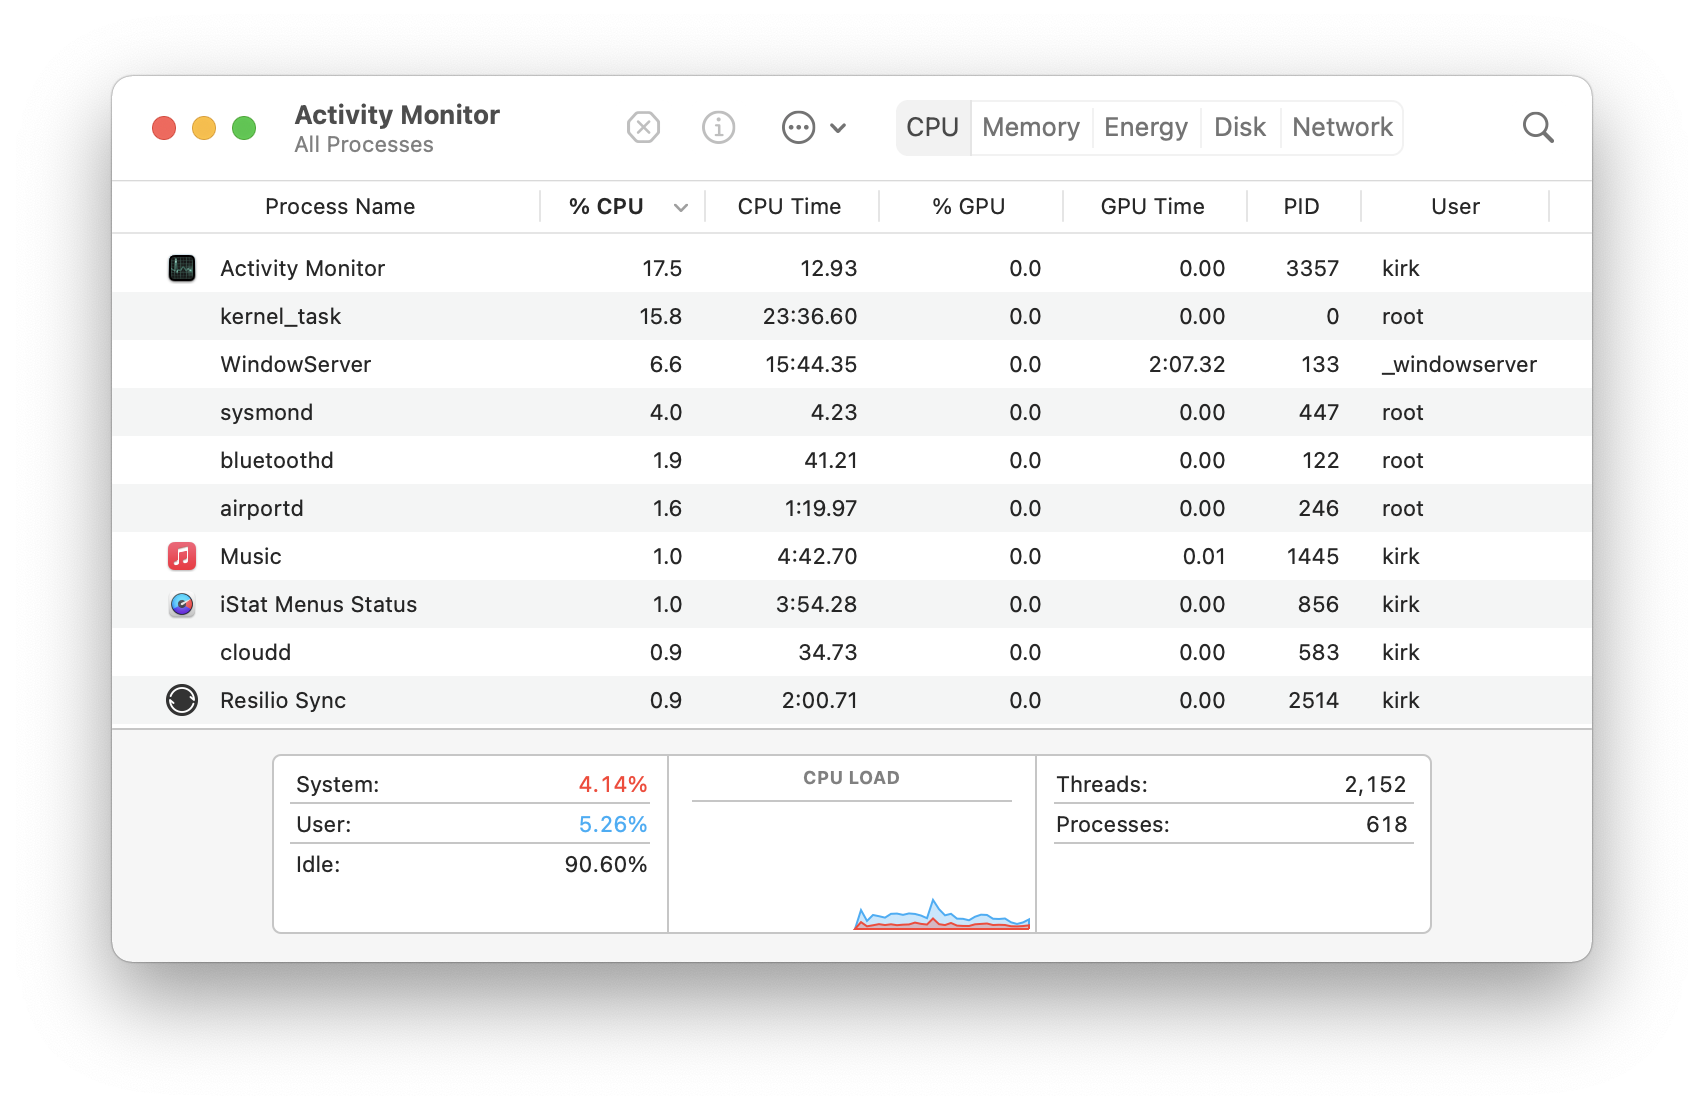
The CPU tab shows how your Mac’s processor(s) are working. In the above screenshot, I’ve sorted the list by % CPU, or the percentage of the total available CPU time. You may see apps or processes that are using more than 100% of CPU time; this is because a Mac with multiple cores (all recent Macs) count each core as 100%. So my eight-core iMac has a total of 800% of CPU time available.
This tab lets you know which apps are working the hardest. If, for example, the fan on your Mac becomes loud, or you see the battery on your laptop depleting quickly, check the CPU tab to see which apps are taxing the processor. In some cases, these may be runaway apps that are stuck.
If you find an app that’s not running correctly—or one that shows in red, with the words “Not Responding” after it—click that app’s or process’s name, and then click the X button in the toolbar. Activity Monitor will ask if you are sure you want to quit this process. If you click Quit, it will try to quit the app in the normal manner. If this doesn’t work, click Force Quit, and, in almost all cases, Activity Monitor will be able to quit the app, removing the offending laggard. If for some reason Activity Monitor can’t quit the app, restart your Mac and check Activity Monitor again.
Read about other methods for force quitting apps on macOS.
The Memory Tab
This tab gives you an idea of how much RAM your apps are using.
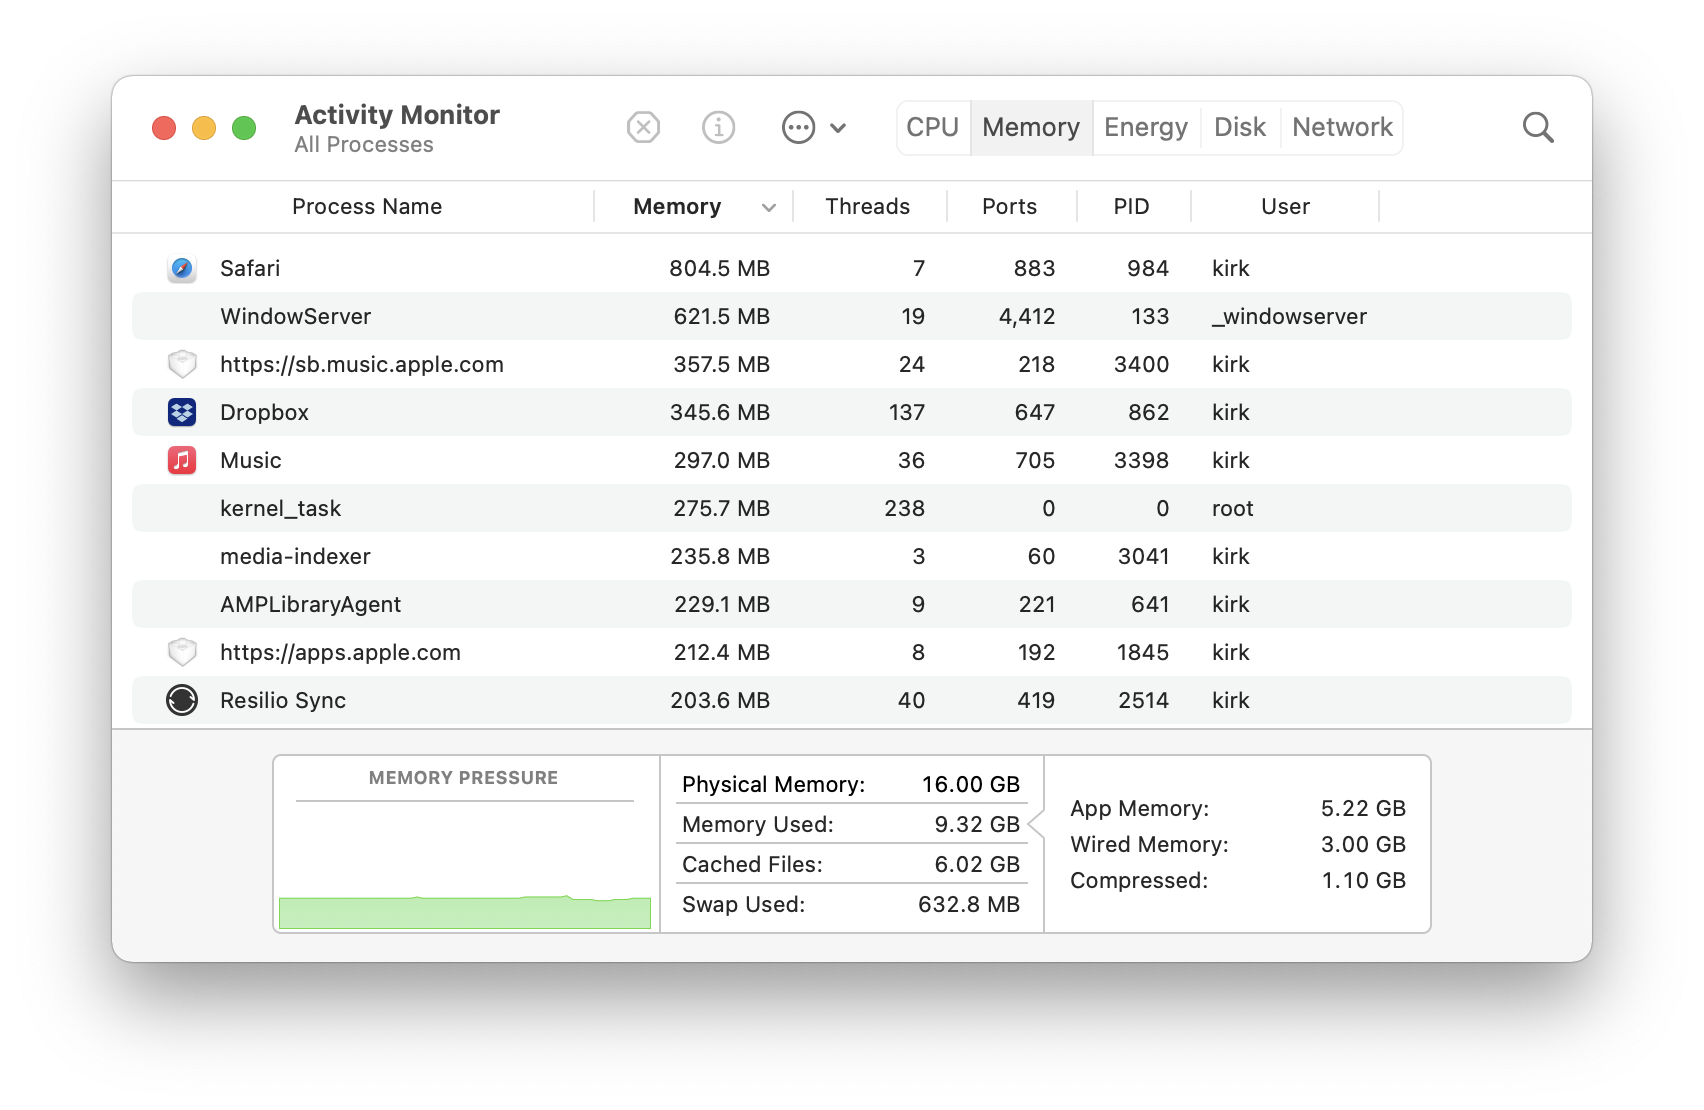
You can find the most RAM-hungry apps, and, if your Mac is running slowly, you can choose to quit them. You may even want to find replacements for apps that regularly max out your RAM.
Also check the bottom section, where you see Swap Used. Swap files are virtual memory files that are written to your Mac’s disk. Reading memory data from these is slower than reading from RAM, and if there is a large amount of swap space used, your Mac will run slowly. This is a good indication that it’s time to restart your computer. This said, with Apple’s M-series processors, swap files are read more quickly than with Intel processors, so you may not have slowdowns even if a lot of swap files are used.
If after a system restart you find that your Mac is still running slowly, have a look at our in-depth guide on how to fix your Mac’s performance issues.
The Energy Tab
The Energy tab tells you which apps and processes use the most power. For a desktop Mac, this isn’t very important, but if you’re seeing poor battery life on a laptop, this is the place to check.
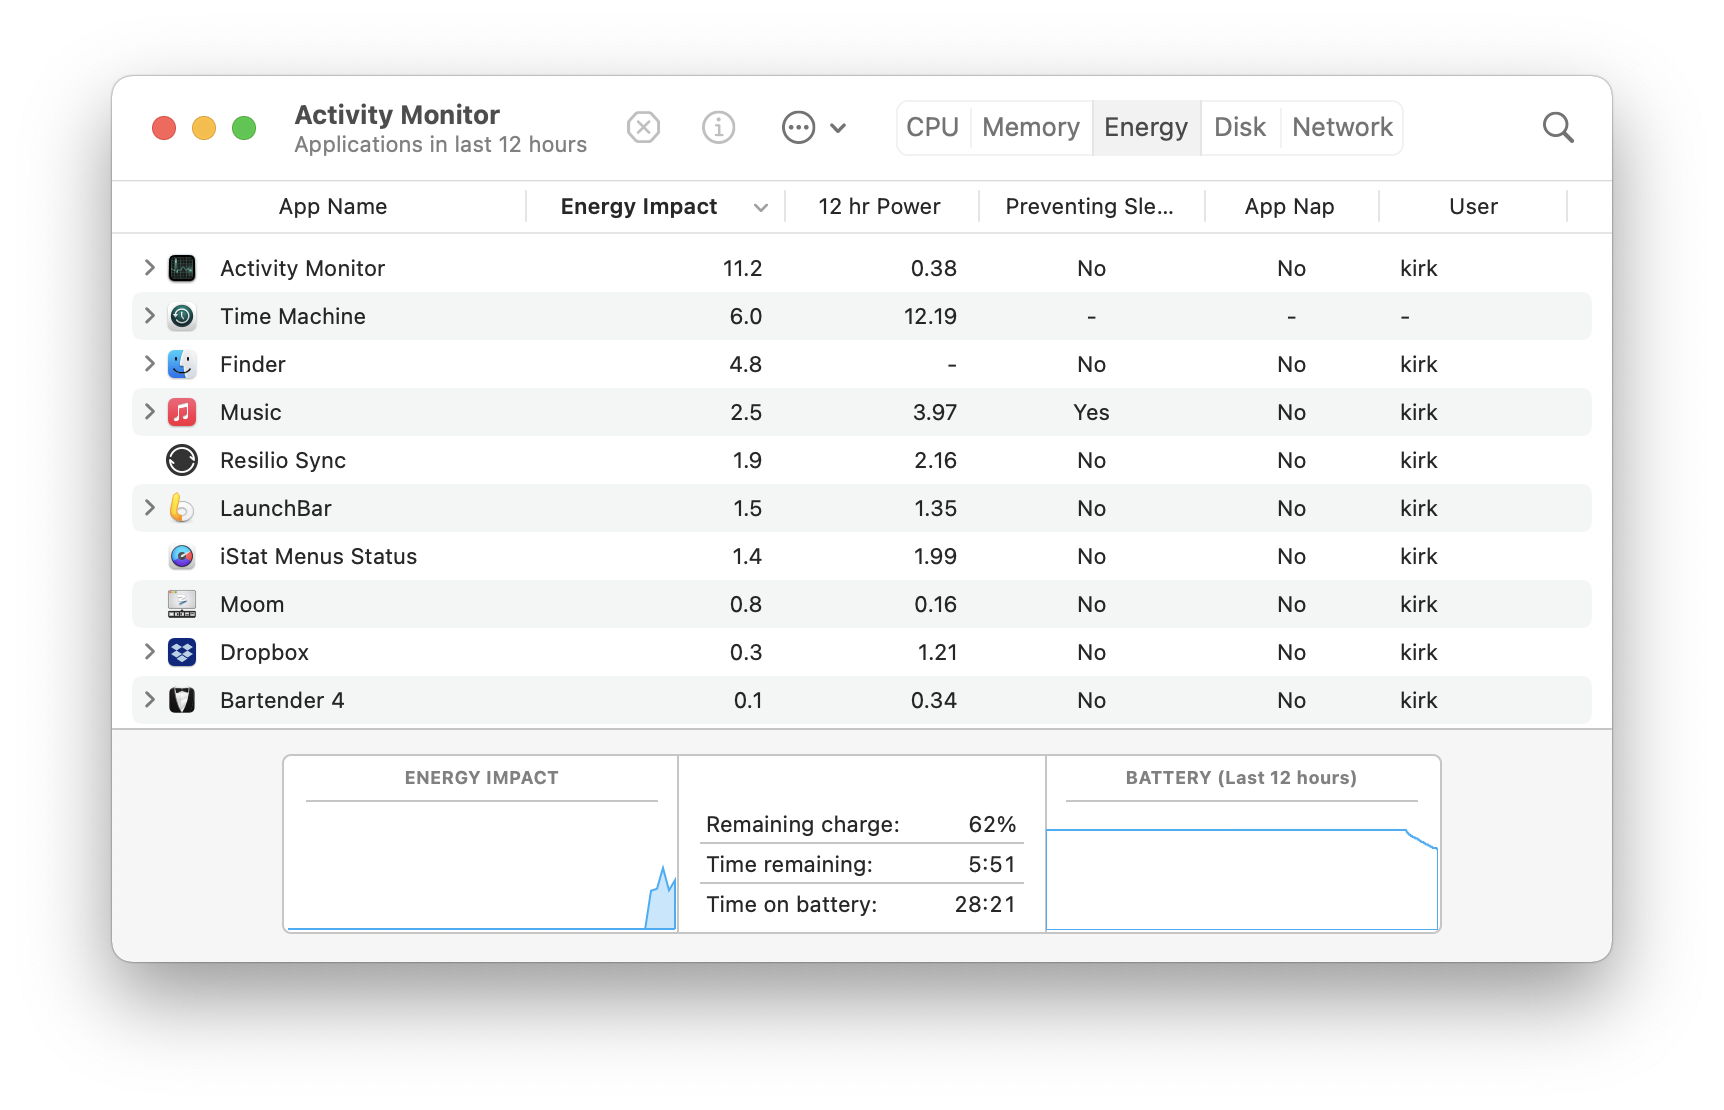
The Energy Impact column updates regularly, and it shows the current power usage, but this varies a great deal depending in which apps you use. The most important column is 12 hr Power. This shows which apps use the most power over the past twelve hours, including time when your Mac was asleep. If your laptop’s battery life is insufficient, check here to see if you’re using an app that’s depleting the battery. This can be a good way of deciding which web browser to use on your laptop. You might try using, say, Safari, Firefox, and Chrome, each for a few days, to see which one uses the least amount of power.
The Disk Tab
Most users don’t need to worry about the Disk tab. This shows how much data is being written to and read from your Mac’s drives.
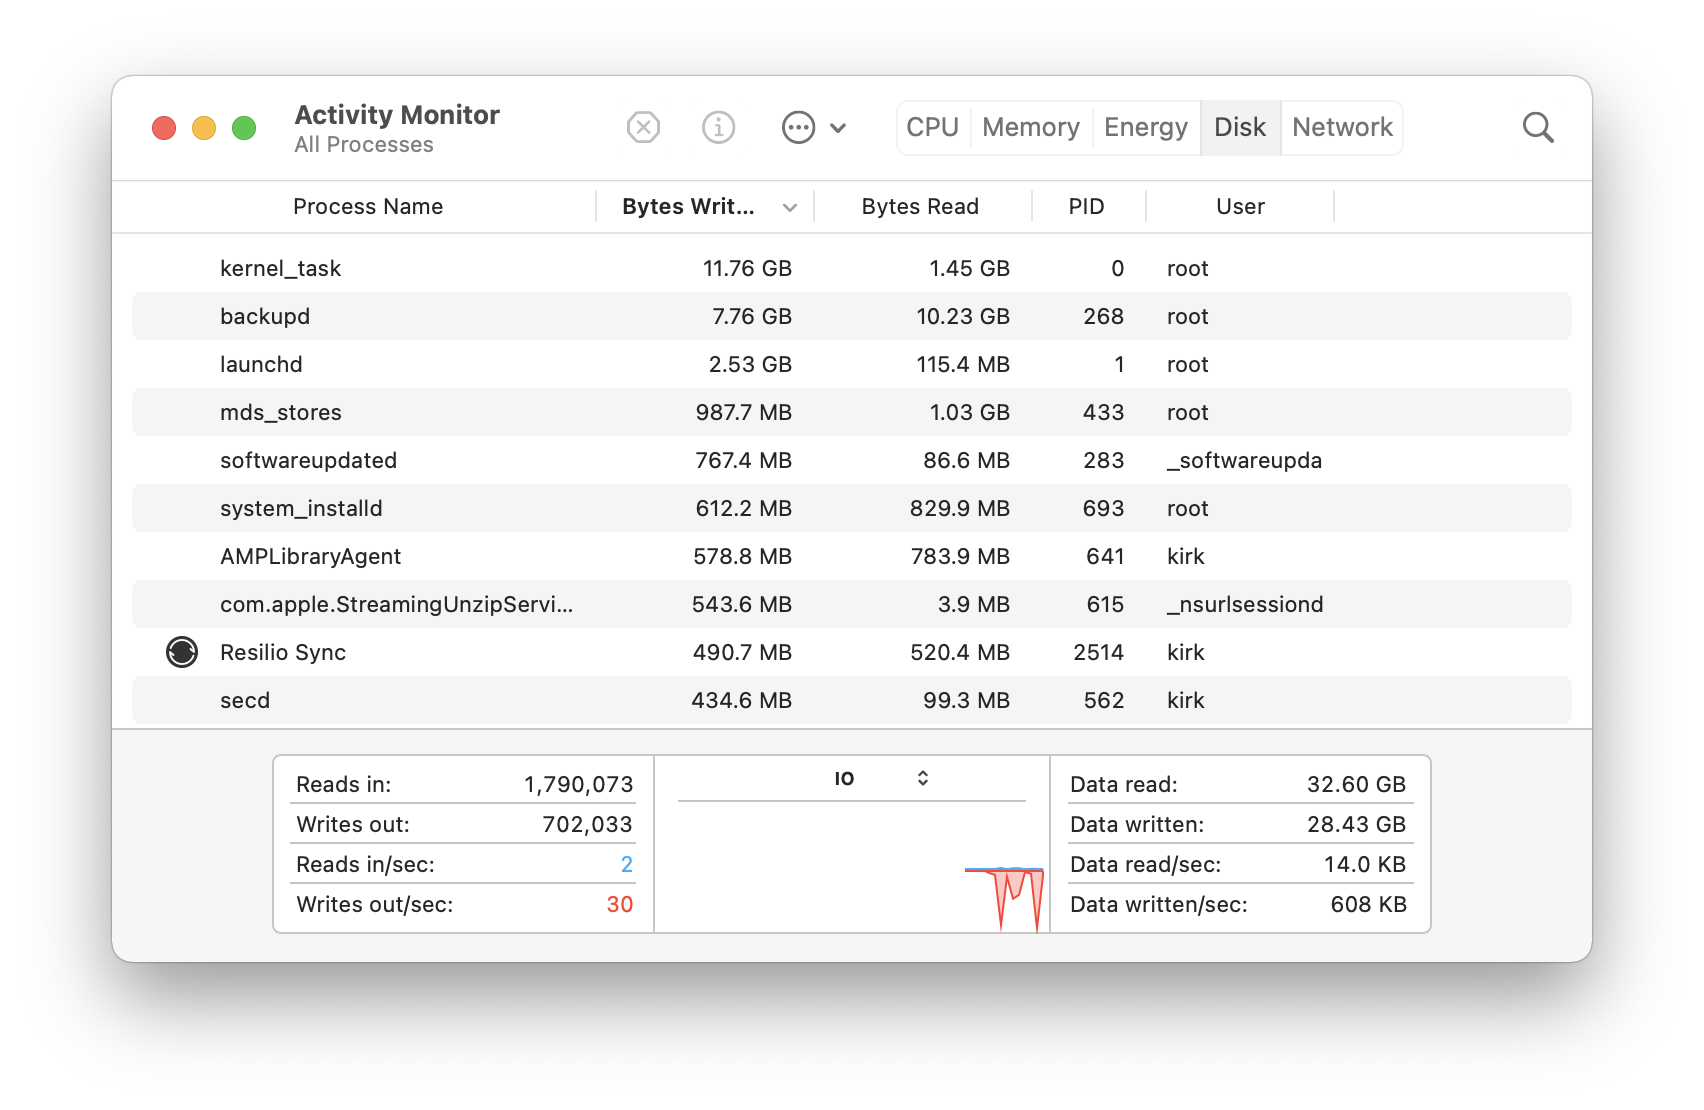
Reading from and writing to a disk also uses power, so if you see a lot of disk activity, and your battery isn’t lasting as long as you expect, have a look at which apps are doing this. One process that may show a lot of activity is cloudd, which is the background process that handles reading and writing data from iCloud. If this number is high, it could be because you downloaded a lot of music or movies, added a lot of photos to your Photos library, or you have worked on a lot of files in iCloud Drive.
The Network Tab
This tab shows how much data is entering and leaving your Mac over its network interfaces for active apps and processes. You can sort by Sent Bytes, Rcvd Bytes, Sent Packets, or Rcvd Packets.
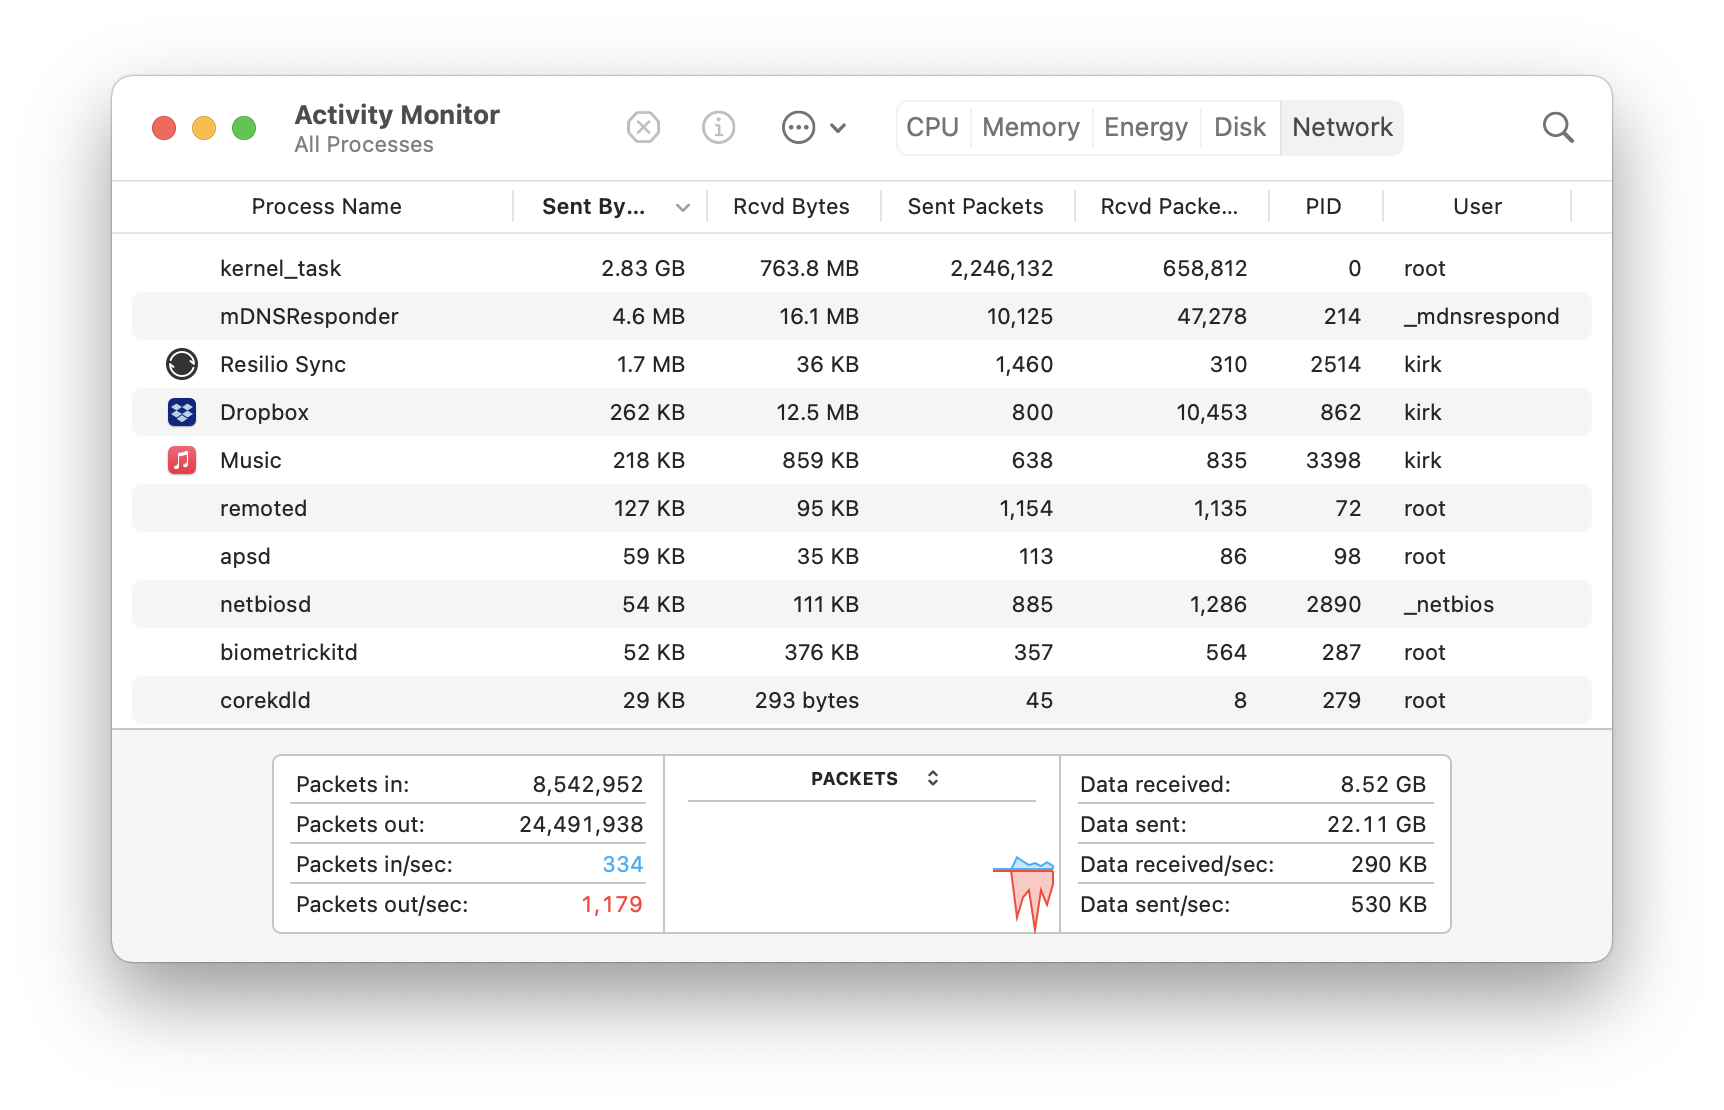
If you have trouble accessing the Internet, there can be numerous causes. Some have to do with your connection, but your network access can also slow down if there’s a lot of data coming into or leaving your Mac. For example, your upstream bandwidth is most likely lower than your downstream bandwidth. If the former is saturated, you’ll find that even loading simple web pages can be painful.
But don’t just look at those Sent Bytes or Rcvd Bytes columns; they show totals since the last time you launched each app or the last time you restarted your Mac, for system processes. Instead, focus on the information displayed at the bottom right, at Data received/sec and Data sent/sec. Those numbers will give you an idea if you’re sending or receiving a lot of data. You can then check the totals by app, and monitor them to see if they increase. Check the Sent Bytes to see if your upstream bandwidth is being used, and your Rcvd Bytes to see if downstream bandwidth is used.
Note that if you want to find out if there’s any excess data usage for Safari, this data is listed under the process Safari Networking, not the Safari app itself. If you want to focus on a specific app or process, you can narrow down the display by typing the name of the process in the search field.
While it’s easy to see what’s using data among apps that access the Internet, don’t forget that you’ll see a lot of data being moved across your local network if you have more than one computer and transfer files between them. The Network pane shows all your network activity, not just to and from the Internet. If, for example, you have Time Machine backups going to a network server, then you’ll see a lot of data sent and received here.
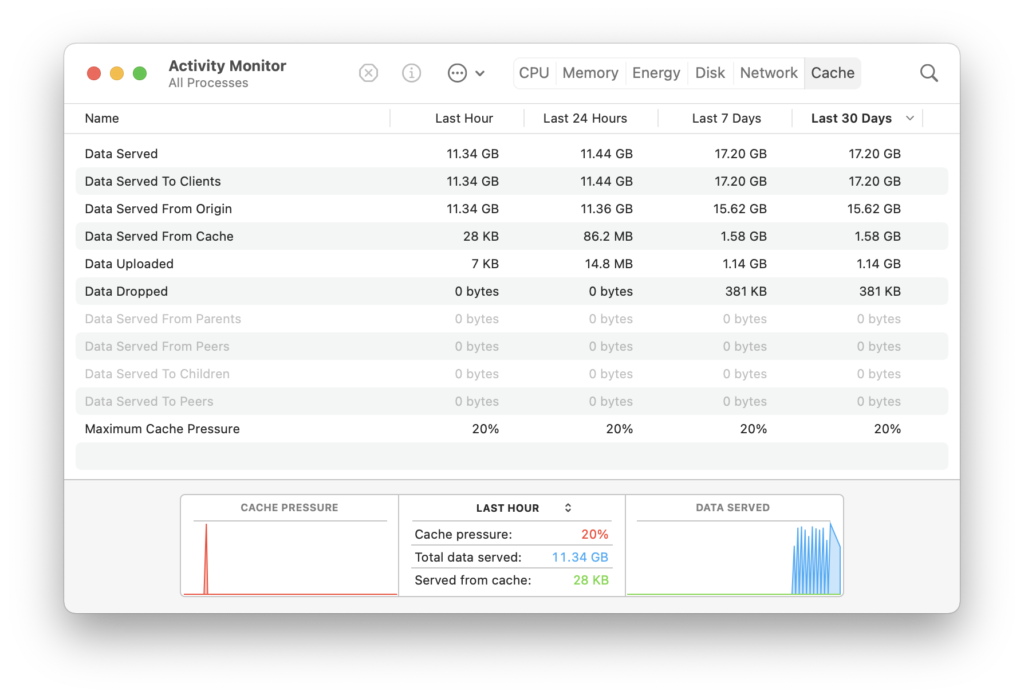
The Cache Tab
If your Mac is running the content caching service, which can save you bandwidth by storing copies of content you download from Apple’s servers, you’ll see a sixth tab: Cache. This tab shows how much data has been served, cached, etc. See this article for more on content caching.
Activity Monitor is just one of the useful tools on a Mac that can help you troubleshoot problems and keep your computer running smoothly. Get to know it so when you need to troubleshoot you can find some pertinent information about how your Mac is running.
How can I learn more?
 Each week on the Intego Mac Podcast, Intego’s Mac security experts discuss the latest Apple news, security and privacy stories, and offer practical advice on getting the most out of your Apple devices. Be sure to follow the podcast to make sure you don’t miss any episodes.
You can also subscribe to our e-mail newsletter and keep an eye here on Mac Security Blog for the latest Apple security and privacy news. And don’t forget to follow Intego on your favorite social media channels: Facebook, Instagram, Twitter, and YouTube.