
Using VirusBarrier X6 Monitoring Tools
- The VirusBarrier X6 Log
- Traffic Monitors
- Viewing Active Services
- Viewing Network Information
- Whois Queries
- Traceroute Searches
VirusBarrier X6 contains a number of monitoring tools to help you see which actions the program has carried out on malware, to record network activity and intrusion attempts, and to give you an overview of your Mac's activity in real time. From the log, which shows both malware scan results and network activity, to the VirusBarrier Traffic Monitor, which shows current network throughput, these tools and others help you manage your Mac and its network activity.
The VirusBarrier X6 Log
To access the VirusBarrier X6 log , click the small "magnifying glass" icon at the bottom of the screen, choose Window > Logs, or press Command-Option-L.

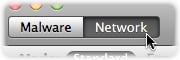
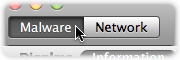
When the log window displays, you'll see two buttons at the top-left: Malware and Network. You can view either of these two logs by clicking the appropriate button.
The Network Log
The network log shows a record of all network activity that VirusBarrier X6 has observed, as well as all intrusion attempts that VirusBarrier X6 has blocked. You can apply filters to it on several criteria to highlight issues of interest.
To access the network log, click the Network button in the top-left corner of the Log window, if it isn't already selected.
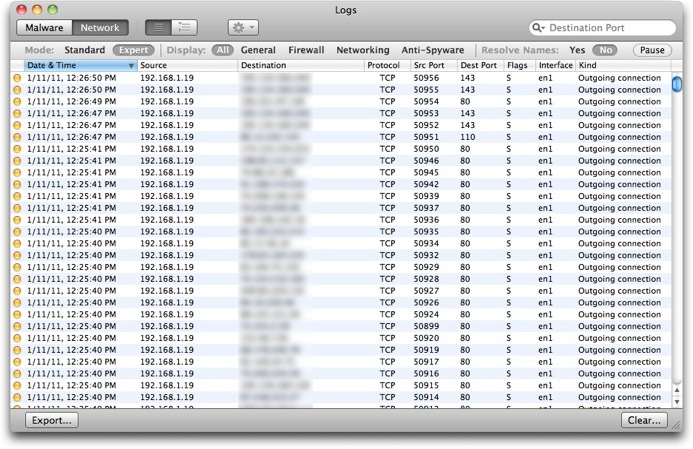
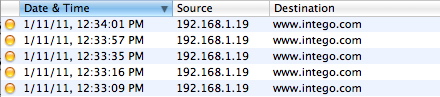
You'll see the network log window. Of course your entries won't be the same as those shown here, but rather will reflect activity on your Mac since you installed VirusBarrier X6 (or last cleared the log).
Network Log View Options
The top of the log window contains three groups of options that affect how the log appears.
- The first group toggles between the default Standard view and an extended Expert view;
- The second group shows subsets of log activity to help you see potential issues more clearly;
- The third group lets you choose whether to view raw IP addresses or domain names using DNS lookup.
We'll examine each of these sets of options separately.
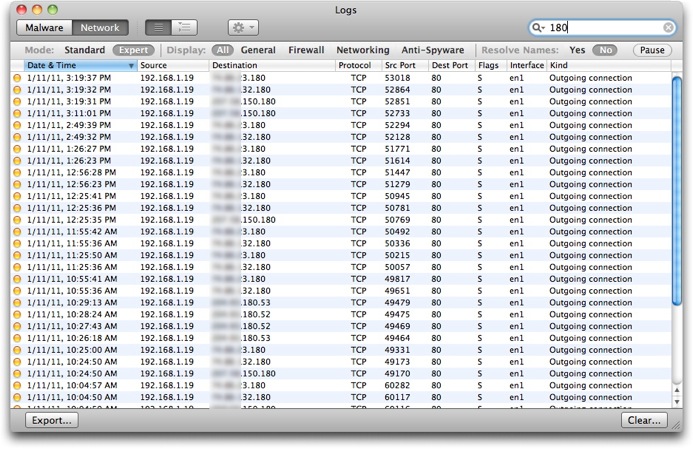
Standard and Expert Log Views

Standard: The default view for the Log screen. This displays only four pieces of information for each Log entry.
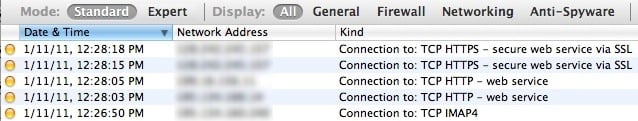
- Type of activity, indicated by dot color:
- Yellow: Notable event, such as an outgoing connection, incorrect login, blocked outgoing data, etc.
- Red: Network attack, blocking of address in the Blocked Addresses list, Anti-Spyware blocking, etc.
- Date & Time of activity, according to your Mac's clock setting.
- Network Address, given by default as an IP address. If you've checked Resolve Names (see below), you'll see the domain names for those addresses that VirusBarrier X6 was able to resolve.
- Kind, a short description of the activity.
Expert: An extended view, shows the following additional fields where applicable.
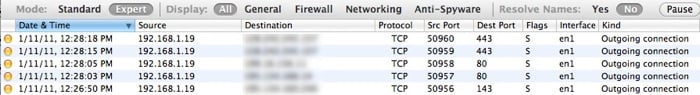
- Source, which is the originating IP address (or domain) of the incident. For most activities, the source will be your Mac's IP address, although for attacks or other incoming connections it will be that of the remote computer. If you have checked Resolve Names, you will see the domain names for those addresses that VirusBarrier X6 was able to resolve.
- Destination, given by default as an IP address.
- Protocol, which describes how the connection was attempted, i.e. TCP, UDP, ICMP or IGMP.
- Source Port, the port from which data was sent.
- Destination Port, the intended port for the data.
- Flags, or TCP flags: A (acknowledge), S (synchronize), F (end of data), or R (reset).
- Interface, the network interface used to send the data, such as Ethernet or AirPort, given by BSD Name.
- Kind, a short description of the activity.
Viewing Subsets of the Network Log
Activities fall into four groups: General, Firewall, Networking and Anti-Spyware. You can choose to see activities relating to all the groups at once, or only activities relating to a specific one. Click one of the buttons to change the log view.

- All: All activity that VirusBarrier X6 tracks. This is the default setting.
- General: Activity related to the operation of VirusBarrier X6 itself, such as instances when you launched and quit the program, added applications to Anti-Spyware, entered items into the Blocked Addresses or Trusted Addresses list, and so forth.
- Firewall: Incidents when network activity triggered a firewall rule, if logging was turned on for that rule. Records of any Trojan horse attacks also appear in the Log, if you've turned on Trojan protection.
- Networking: All connections to networks or the Internet, and when IP addresses in the Blocked Addresses list attempt to connect to your computer.
- Anti-Spyware: A subset of the General group, showing only when applications were added to or removed from the Anti-Spyware list, or when Anti-Spyware rules were called into play.
Resolving Domain Names in the Network Log

VirusBarrier X6 helps you track down intruders by resolving the domain names of your connections. Internet addresses exist in two forms: IP numbers, such as 192.168.1.1, and names, such as example.com. The correspondence between the two is recorded in domain name servers throughout the Internet.
When Resolve Names is checked in the Log panel, VirusBarrier X6 will attempt to find the names for each of the Internet addresses shown in the log. If VirusBarrier X6 can find this information, it then displays it in name form rather than as numbers.
VirusBarrier X6 is not able to resolve the names of all Internet addresses, since some addresses have no name equivalents.
Network Log Window Contextual Menu
If you hold down the Control key and click any log entry, or right-click on a log entry, a contextual menu displays.
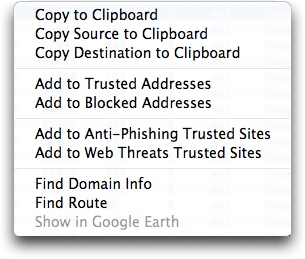
Its options are:
- Copy to Clipboard: Copies visible columns of this log entry to the Mac OS X clipboard, in tab-delimited text format. You can then paste it into any application or document.
- Copy Source to Clipboard: Copies only the Source field of this log entry to the Mac OS X clipboard: only available when viewing the log in Expert mode.
- Copy Destination to Clipboard: Copies only the Destination field of this log entry to the Mac OS X clipboard: only available when viewing the log in Expert mode.
- Add to Trusted Addresses: Permanently adds this IP address to the Trusted Addresses, thereby allowing future communications from it regardless of Antivandal settings. However, VirusBarrier X6's firewall will still affect communications from this IP address.
- Add to Blocked Addresses: Permanently adds this IP address to the Blocked Addresses, thereby preventing future communications from it regardless of Antivandal settings.
- Add to Anti-Phishing Trusted Sites: Permanently adds this IP address to the list of Anti-Phishing Trusted Sites, thereby allowing future communications from it regardless of Anti-Phishing settings.
- Add to Web Threats Trusted Sites: Permanently adds this IP address to the list of Web Threats Trusted Sites, thereby allowing future communications from it regardless of Web Threats settings.
- Find Domain Info: Launches VirusBarrier X6's Whois window and performs a query on the selected IP address. See Whois Queries for more information.
- Find Route: Launches VirusBarrier X6's Traceroute window and performs a search on the selected IP address. See Traceroute Searches for more information.
- Show in Google Earth: Launches the Google Earth program, if you have it installed, and attempts to find the geographic location of the selected IP address.
Filtering Data in the Network Log Window
At the top of the log window toolbar is a search field that lets you filter data according to several criteria, displaying only those entries that contain the selected criteria in the following categories:
- Source address
- Destination address
- Source port
- Destination port
- Interface
- Protocol
Source Address is the default criterion, as the search field shows.

To search for log data containing any of these criteria, click the disclosure triangle next to the Search icon.
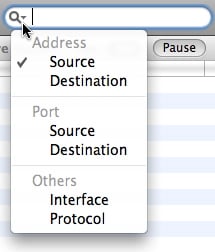
Select the criterion you want to search for, then enter a string in the search field. You don't need to enter the entire string; the display is dynamic, and automatically narrows down log data as you enter characters in the search field.
In the example below, we're searching for "180" in the Destination Address. The search string can occur anywhere in the field, not just at the beginning. Also, the search works even if you're viewing the log in Standard mode, where the search field (the Destination, in this case) is hidden.
To clear the search field and begin a new search, click the small "X" button in the search field.
The Malware Log
The malware log shows a record of malware activity that VirusBarrier X6 has observed, including all manual and scheduled scans, and the results of these scans. As with the network log, you can filter it to highlight issues of interest.
To access the malware log, click the small "magnifying glass" icon at the bottom of the screen, choose Window > Logs, or press Command-Option-L.

Then click the Malware button in the top-left corner if it isn't already selected.
The log looks as follows, although of course your log will show different entries from this one.
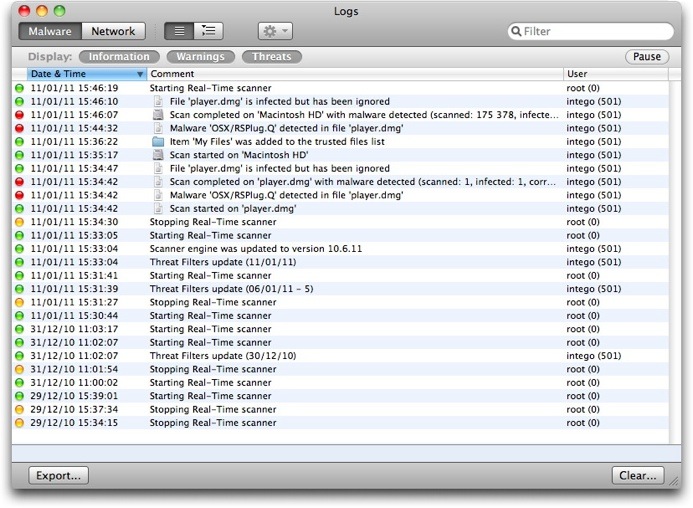
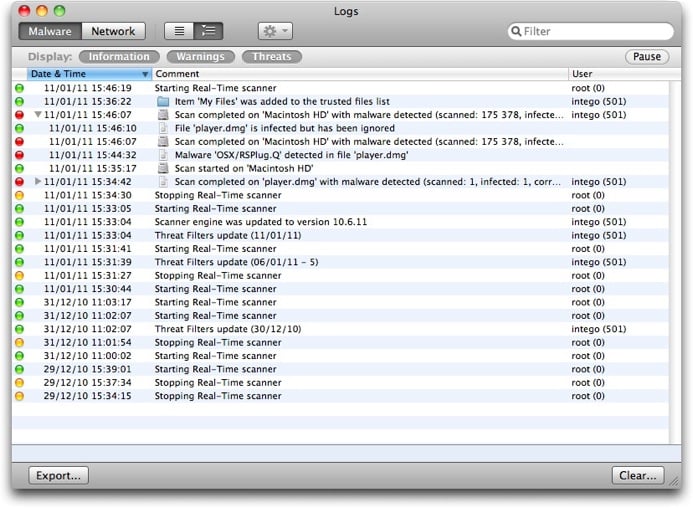
There are two ways you can display log information. In the example above, log entries are shown in linear order, each one taking up one line. You can click the second button at the top-left of the window and display log entries in hierarchical order, where disclosure triangles group related entries:
The Log shows every time that:
- You start a scan
- You cancel a scan in mid-process
- You start or stop the real-time scanner
- VirusBarrier X6 finishes a scan, with its results
- VirusBarrier X6 discovers a virus
- VirusBarrier X6 discovers a corrupted file
- VirusBarrier X6 repairs an infected file
- Files are added to or removed from the Quarantine Zone
- Files are added to or removed from the Trusted Files list
- Virus definitions are updated
The colored dots in the leftmost column show you what types of entries are displayed in the log. Green dots indicate information, such as starting the real-time scanner or updating virus definitions. Orange dots are for warnings, such as stopping the real-time scanner. Red dots indicate threats, such as when infected or corrupted files are found. The files, folders or volumes selected for each scan are named, as are all problems found.
You can choose to only display certain types of information by clicking one of the three log type buttons to hide or display their entries.

You can perform actions on some log entries by selecting them and clicking on the Action button in the log window toolbar, or by Control-clicking or right-clicking. You'll see a contextual menu that offers three options:
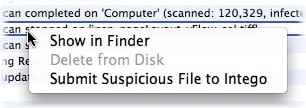
- Show in Finder: this opens a Finder window with the selected file highlighted so you can see where it is and either delete it or perform other actions on it.
- Delete from Disk: this option is only available for corrupted files; if you choose it, the corrupted file will be deleted from your disk
- Submit Suspicious File to Intego: choose this to send any suspicious files to Intego for our Virus Monitoring Center to examine
You can also filter search results by entering text in the search field in the window's toolbar. As you type text, the results will narrow down, showing only those log entries that contain the text you have typed.
You can copy any log items by selecting them and pressing Command-C; you can then paste them into another application, if needed.
You can remove any log items by selecting them and pressing Delete. You can clear the entire log by clicking the Clear... button.
Features Common to Both the Network and Malware Logs
Pausing the Log

If you have many connections entering and leaving your computer, you may find it difficult to follow the log as it displays. To view the log more easily, click the Pause button in the log window's upper-right corner. The log display stops so you can read the data, but keeps recording and will display new data when the log is no longer paused. Click the Pause button again to resume real-time display.
Clearing the Log

To clear the log, and erase all information it contains, click the Clear... button in the lower-right corner. A dialog appears, asking you to confirm your request.
The log will also be cleared automatically if you've checked the Clear log after exporting checkbox in the Log Preferences and have set VirusBarrier X6 to export a log periodically. See Preferences and Configurations for more about log preferences.
Exporting the Log

You can export log data in several formats. When doing a manual export, only the data displayed is exported. If you have only checked, say, Firewall in the Log panel, only firewall data will be exported. (You can also have the Log data exported automatically: See Preferences and Configurations for more about log preferences.)
To export Log data, click the Export... button. A dialog will prompt you to save the file; you may change its name if you wish. Choose where you wish to save it; by default, export files are saved to your Documents folder.
WARNING: Log exports may take several minutes if the Resolve Names feature is turned on.
Logs can be exported in six formats. Click the Format popup menu to select the export format.

The available formats are:
- Expert HTML: HTML format, showing all columns visible in Expert mode. In this format you can partially retrace past browsing history, as VirusBarrier X6 provides clickable links for all log entries for non-secure Web pages. (That is, Destination Ports, connected by TCP, targeting ports 80 or 8080.)
- Expert Text: Tab-delimited, plain text format with additional columns to show all columns visible in Expert mode. This is the best mode to use for import into a spreadsheet or database program.
- HTML: HTML format, showing all columns visible in Standard mode. As with Expert HTML exports, this file format helps you retrace past browsing history.
- Analytic: A text format similar to Expert Text, without tab separators, but with labels in front of some fields.
- Text: Tab-delimited, plain text format with all columns visible in Standard mode.
- Who's there?: The log as a text file, with the following columns: Date, Time, Result, Hostname, Server Port, and Method: useful in some log analysis programs.
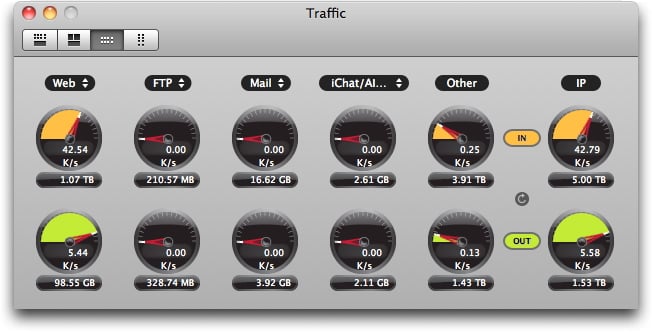
Traffic Monitors
VirusBarrier X6 has a number of tools that let you monitor network traffic entering or leaving your Mac, conduct queries and searches on network addresses and see which services and networks are available to your Mac.
Traffic Window
The Traffic window contains a set of activity gauges that tell you the type and quantity of network activity that is coming into and going out of your Mac from both the Internet and local networks. To access the Traffic window, click the small icon shown below, choose Window > Traffic, or press Command-Option-4.

The Traffic screen has four viewing modes, switchable by clicking the small buttons at the top of the screen.

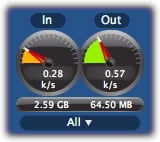
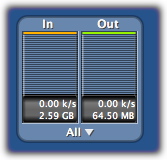
The first button is the default view and shows traffic as two rows of gauges and a timeline.
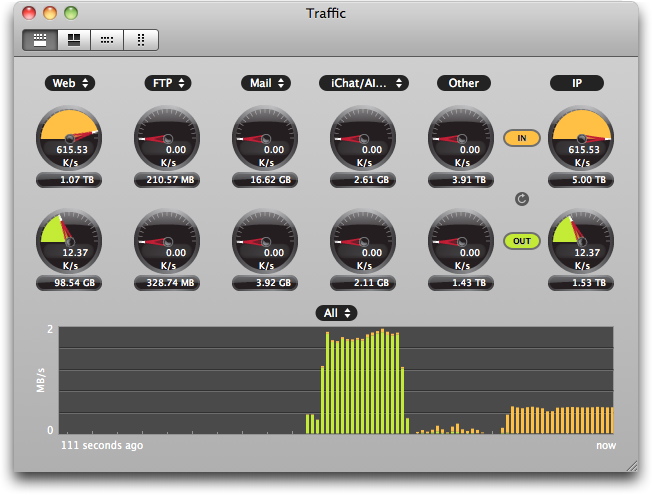
The IN gauges on top, with values shown in orange by default, display the amount of data coming into your Mac. The OUT gauges in the second row, with values shown in green by default, display the amount of data leaving your computer. The number inside the gauge is the current throughput in kilobytes per second (k/s), and the bottom is the total amount, usually in megabytes (MB) or gigabytes (GB).
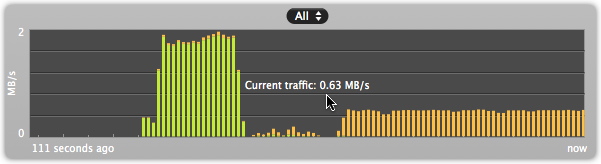
The timeline at the bottom shows traffic over time, where the bars the furthest to the right represent the present time, and those to the left represent the past. As above, orange values show incoming traffic while green values show outgoing traffic.
By default, the timeline records activity going back 111 seconds in time. You can increase this time period by making the window larger, either by clicking the green zoom button in the upper-left corner, or by clicking and dragging the window's bottom-right corner. The maximum time is determined by the size of your screen or your willingness to see only a section of the timeline at one time.
If you place your cursor over a timeline, text appears showing the current average data throughput, which is updated every second.
The second view button shows traffic as three timelines, respectively showing traffic in, out, and in total.
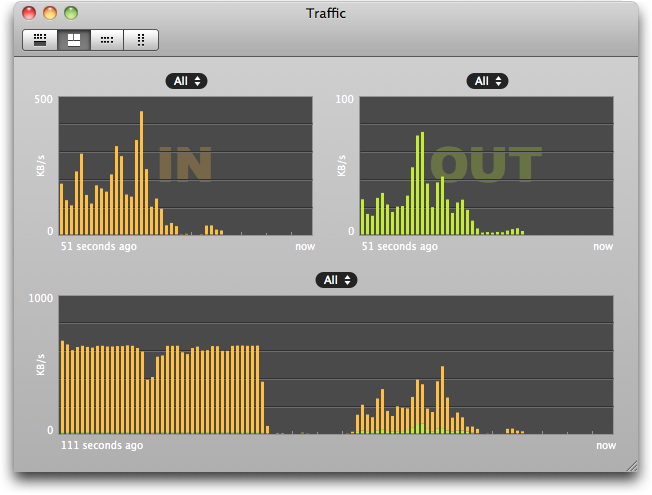
This view mode has a special feature that lets you choose the scale for the In and Out graphs by moving the mouse over one of them, holding down the Control key, and clicking, or right-clicking, a popup menu offers several options.
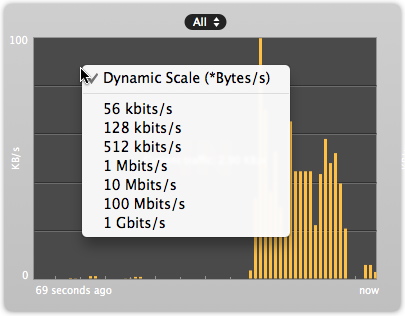
This lets you choose your maximal throughput and displays graphs that are correctly scaled for that throughput. Choose Dynamic Scale if you want the graph to change its scale according to the data throughput as described earlier.
The third view mode button shows traffic as a series of gauges in horizontal orientation, with no timeline. The fourth button shows the same gauges, but in a vertical orientation (not shown here).
The three views that contain round gauges also have Reset buttons. Clicking this button sets the totalizing, bottom row of gauges back to zero.

Selecting Activity Data Types
In each view mode, you have a choice of which type of traffic to view: by default, the activity data types monitored are Web, FTP, Mail, iChat/AIM. The fifth gauge shows all other traffic, while the sixth shows total traffic.
But you can choose which type of data will be shown for the first four pairs of gauges by clicking the indicator over one of the gauges.

A popup menu displays showing several choices.
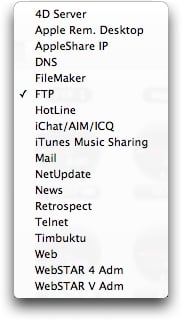
You can add or remove services from this list through the Traffic Preferences pane: see Traffic Preferences in See Preferences and Configurations for details.
Viewing Network Traffic in the Menu Bar
VirusBarrier X6 can also display network traffic in the menu bar. You can access this feature from VirusBarrier X6's Preferences. Choose VirusBarrier X6 > Preferences... then click on the Traffic icon. Check Display network traffic in the menu bar to turn this feature on. This displays the amount of incoming and outgoing traffic at all times. You can turn this off by unchecking Display network traffic in the menu bar.
VirusBarrier Traffic Monitor
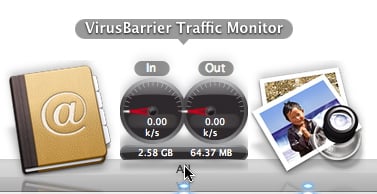
Installing VirusBarrier X6 also places an application called VirusBarrier Traffic Monitor in your Applications folder. You can launch this program by double-clicking its icon, or from the Intego Menu by choosing VirusBarrier X6 > Open VirusBarrier Traffic Monitor.
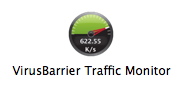
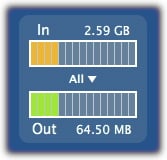
The VirusBarrier Traffic Monitor application provides a small, floating window that lets you keep an eye on network activity at all times, without needing to display the entire VirusBarrier X6 activity gauge palette.
When you open VirusBarrier Traffic Monitor, it displays its activity gauge window in the bottom-right corner of your screen. You can move VirusBarrier Traffic Monitor by clicking it and dragging to a new place on your screen.
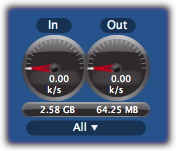
By default, VirusBarrier Traffic Monitor displays the total network traffic for all services. You can change what kind of traffic is displayed by clicking All at the bottom of the VirusBarrier Traffic Monitor window, and selecting a service from the popup menu.
If you hold down the Control key on your keyboard and click anywhere in the VirusBarrier Traffic Monitor window, a popup menu offers two options.

Show in Dock closes VirusBarrier Traffic Monitor's window, and the program's Dock icon changes to show its activity gauges, updated in real time.
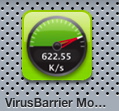
Network activity also appears in the VirusBarrier Traffic Monitor icon you see when you switch among applications by pressing Command-Tab.
To return VirusBarrier Traffic Monitor to its window, hold down the Control key, click on the VirusBarrier Traffic Monitor Dock icon, and select Show in Window.
When VirusBarrier Traffic Monitor displays in the Dock, you can change its display by holding down the Control key, clicking on its Dock icon, and selecting a different service from its Dock menu.
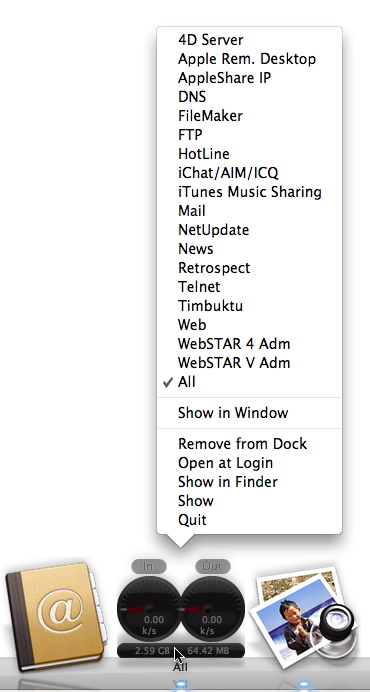
The Keep in Dock selection makes the VirusBarrier Traffic Monitor icon a permanent fixture in the Dock, even when the program is not running, so you can open it just by clicking its Dock icon. The Open at Login selection starts the program each time you start a user's session on your Mac.
VirusBarrier Traffic Monitor Preferences
Several preference settings affect the behavior of VirusBarrier Traffic Monitor. To set them, go to VirusBarrier Traffic Monitor > Preferences or press Command-comma while VirusBarrier Traffic Monitor is running.
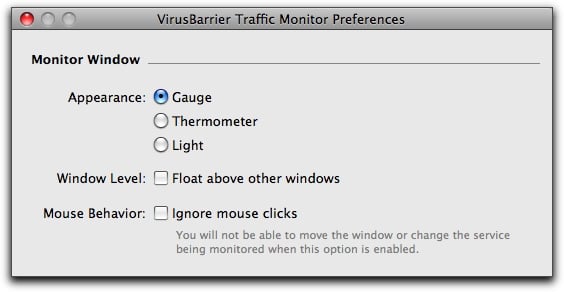
- Appearance: Choose from Gauge, Thermometer or Light:
- Window Level: Float above other windows makes VirusBarrier Traffic Monitor always appear in the foreground, above all other applications.
- Mouse Behavior: Ignore mouse clicks prevents you from moving VirusBarrier Traffic Monitor's window or changing the service it monitors.
The VirusBarrier Traffic Monitor Widget
VirusBarrier X6 installs the VirusBarrier Traffic Monitor widget that loads into Mac OS X's Dashboard to show you network activity when you are in Dashboard.
To display the VirusBarrier Traffic Monitor widget, activate Dashboard. Click the + button to display all the widgets available on your computer. Select VirusBarrier Traffic Monitor from the list. Its icon looks like this:
If you add it to your active widgets, you will see VirusBarrier Traffic Monitor whenever you switch to Dashboard. As with the VirusBarrier Traffic Monitor application, you can move the window or change the type of activity displayed.
The VirusBarrier X6 Monitor Screen Saver
VirusBarrier X6 installs a screen saver that gives you an overview of network activity when your computer is otherwise idle. In addition, if your Macintosh is running as a server, you can use this screen saver to keep an eye on its network activity.
To use the VirusBarrier X6 screen saver, open the System Preferences from the Apple menu, click on Desktop & Screen Saver, and click the Screen Saver tab. Select VirusBarrierSaver in the screen saver list.
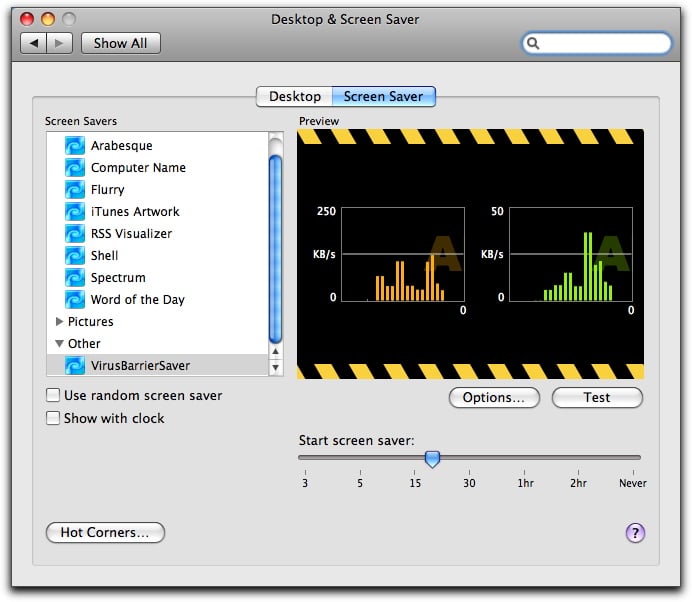
The preview screen only shows All traffic; however, it will show traffic broken down by service when actually running. Click on Options to choose the order in which services are displayed.
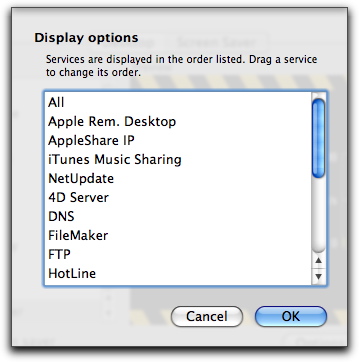
Drag them into the order you want. The number of services displayed depends on your screen resolution and the number of screens you have: therefore, the ones most important to you should be listed first.
For more on screen saver settings, see the Mac OS X help.
Viewing Active Services
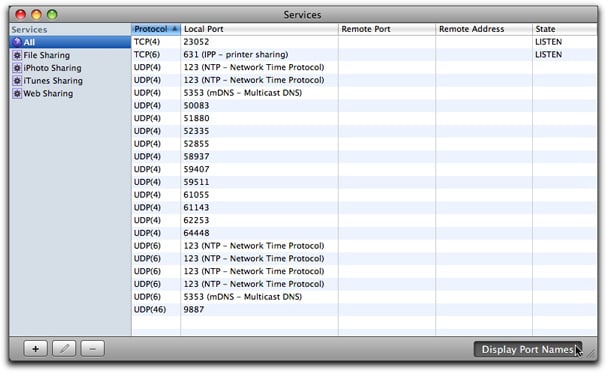
VirusBarrier X6's Services window lists all active network services on your computer that are accessible to other users via Internet Protocol, such as a web server, mail server, etc.
To show the Services window, click the double-arrow icon in the bottom-right corner of VirusBarrier X6's main window.

For each port used you see the following information:
- The protocol (TCP or UDP)
- The local port number (depending on the protocol it represents, if it is a standard protocol, such as port 21 for FTP)
- The remote port number
- The remote address (the IP address of the remote connection)
- The state of the connection - for example, whether the connection is active or if it's just listening for traffic.
To obtain the names of the ports in addition to their numbers, click the Display Port Names button in the lower-right corner, as is shown here.
Since the list of ports used by all services can be long, VirusBarrier X6 provides filters to allow you to view ports used by specific services. You can choose from File Sharing, iPhoto Sharing, iTunes Sharing and Web Sharing by clicking in the left column, or you can create your own filters.
To create a filter, click the + button in the lower-left corner of the panel. The Smart Filter window displays.
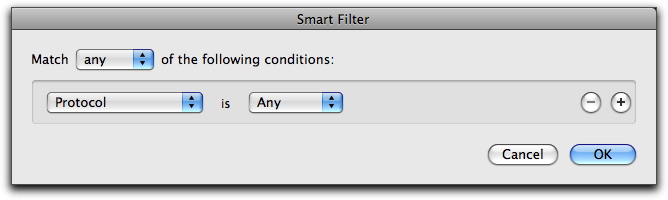
The first popup menu lets you specify whether you want the filter to match Any of the conditions you give, or All of them.
The second popup menu specifies the type of information that you want the filter to find. The choices are the same as the Services window's columns: Protocol, Local Port, Remote Port, Remote Address and State. After choosing one of these, you'll have the opportunity to specify filter details. In this example, we're only going to list those services where the local port is in a given range.
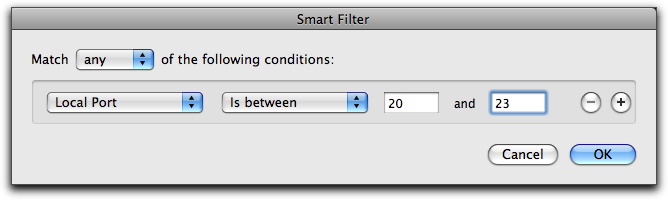
Clicking the + button at the right of the window adds additional conditions, while clicking the - button next to a condition removes it from the list. You can also modify filter conditions by simply changing their popup menu options or typing new data into the data fields.
When you finish creating your filter, click OK to save it, then enter a name for the filter in the Services list. Click the filter at any time in the list to view the network services that correspond to your conditions.
Viewing Network Information
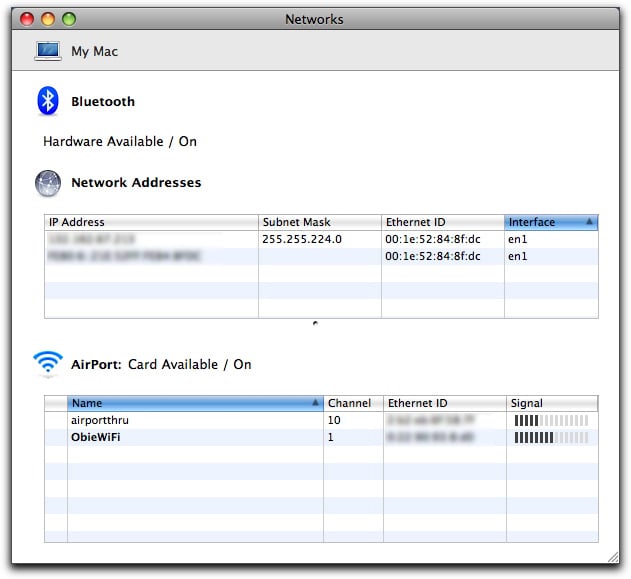
The Networks window provides useful information about your Mac, its network configuration, and local networks available to it. To show the Networks window, click the radio icon in the bottom-right corner of VirusBarrier X6's main window.

The Networks window shows:
- Your Mac's name: Shown in the gray bar at top: in the example below, it's "My Mac". This is the name that your computer shows to anyone browsing for it on a network. You can change this name in the Sharing pane of the System Preferences.
- Bluetooth: Whether Bluetooth hardware is available and active.
- Network Addresses: All the IP addresses that are active on your Mac. If you have several network adapters with different addresses, or are running several servers, more than one address will be shown. It also tells you about any related Subnet Masks, Ethernet IDs and Interfaces (in BSD name format).
- AirPort: Availability and status of a wireless networking card. If your AirPort card is available and on, the table shows available wireless networks, their Channels, Ethernet IDs, and signal strengths in relation to your current position. (The more dark bars, the stronger the signal.) Wireless networks that require a password or other key to join display a small icon of a lock. Those with no lock have no networking password: however, they may be protected in other ways, such as via Web authentication. If you're connected to a wireless network, its name will appear in bold type.
Several functions and options are available for the Networks screen by clicking on the words Network Addresses.
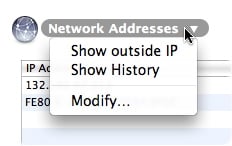
These options are:
- Show outside IP: Shows in large type the IP address that your computer uses when it connects to the Internet or other networks. This address is different from what VirusBarrier X6 displays on this pane if you have a router, a cable or a DSL modem. Click anywhere on the screen to dismiss the information.
- Show History: Displays a list showing the different IP addresses attributed to your Mac by your ISP, if you have dynamic IP addressing. However, if you have a router, or a cable modem, this only shows the IP address your computer uses internally.
- Modify...: Opens the Network pane of Mac OS X's System Preferences. You can change your computer's network settings in this pane. For more on Network settings, see the Mac OS X help.
Additional options are available for individual entries in the Network Addresses area as well. To reveal them, press the Control key while clicking on the entry you mean to affect. A contextual menu appears.
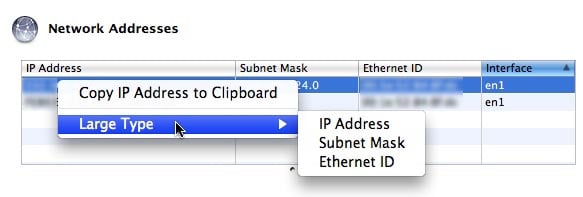
- Copy IP Address to Clipboard: Puts the information in plain text form on the Mac OS X clipboard, where you can paste it in other applications.
- Large Type: Offers to show a full-screen display of any of three kinds of information related to the entry: its IP address, Subnet Mask or Ethernet ID. Clicking anywhere on the screen dismisses the large-type display.
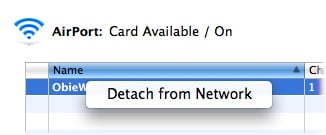
Finally, Control-clicking on entries in the AirPort section brings up a contextual menu where you can detach your Mac from a network to which you're currently attached.
Whois Queries
VirusBarrier X6 allows you to look up domain names and Internet IP addresses using its built-in Whois tool, which you launch by clicking the "?" button in the bottom-right corner of the screen.

Then, enter a domain name or IP address in the Domain field, and click the Whois button or press the Enter key. The large text field below gives you information about the domain, fetched from publicly accessible information servers. You can save this information to a text file by clicking the Save... button.
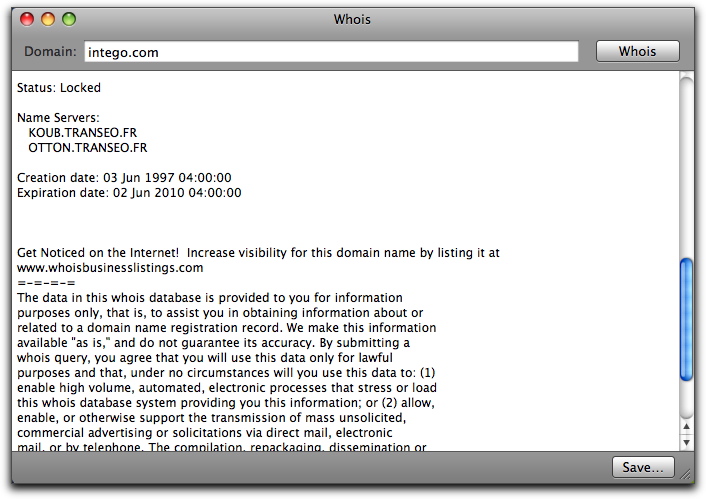
After you receive your information, text in the gray bar at the bottom of the window tells you the name of the server where that information originated. VirusBarrier X6 includes four default Whois servers, but you can change these or add others. To find out how to add Whois servers, see See Preferences and Configurations.
Traceroute Searches
When you send or receive data over the Internet or other networks, it travels in packets from host to host until it reaches its destination, possibly making dozens of hops along the way. VirusBarrier X6's traceroute function can help you see exactly how your data gets to its destination; this is especially useful when you are having problems accessing a specific host, and want to see where the data is blocked. When this happens, it usually means a key host or router is not functioning.
Launch VirusBarrier X6's traceroute tool by clicking the "Y-arrow" button in the bottom-right corner of the screen.

To run a traceroute search, enter an IP address or a domain name in the Network address field, then click Trace or press the Return key. If you enter a domain name, VirusBarrier X6 resolves it and displays the actual IP address. If you click Use ICMP Echo, the traceroute sends ICMP requests instead of UDP requests; in some cases, this may be more effective.
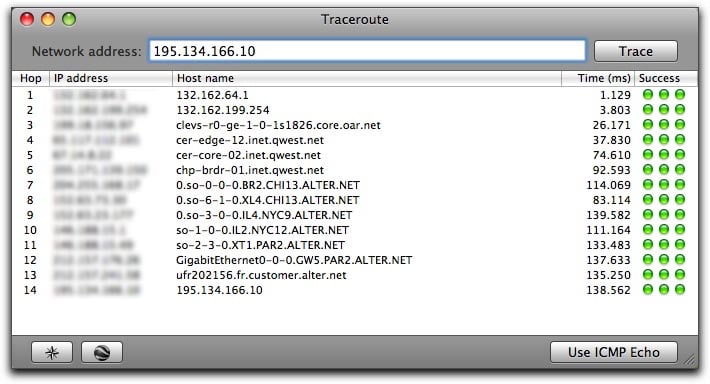
The Traceroute window then shows all the hops between your computer and the final host. For each hop, VirusBarrier X6 displays the hop number, the IP address, the host name, the response time in milliseconds, and the number of pings that succeed (green circles) or fail (red circles). VirusBarrier X6 sends three pings for each hop, or each step along the route. Note that if you have a router on your network, it may not respond to the traceroute request, and may display as failed requests. This won't prevent the rest of the traceroute from being executed.
After your traceroute search has completed, you can Control-click on an entry to view a contextual menu.
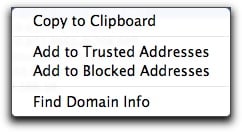
- Copy to Clipboard: Puts the information in plain text form on the Mac OS X clipboard, so you can paste it in other applications.
- Add to Trusted Addresses: Permanently adds this IP address to the Trusted Addresses list, thereby allowing future communications from it regardless of Antivandal settings. However, VirusBarrier X6's firewall will still affect communications from this IP address.
- Add to Blocked Addresses: Permanently adds this IP address to the Blocked Addresses list, thereby blocking future communications from it regardless of Antivandal settings.
- Find Domain Info: Launches VirusBarrier X6's Whois window and performs a search on the selected IP address.
You can see a visual display of the route your data takes by clicking the map rosette button in the bottom-left corner.

This shows a world map with lines connecting each hop, and numbers showing their position on the path.
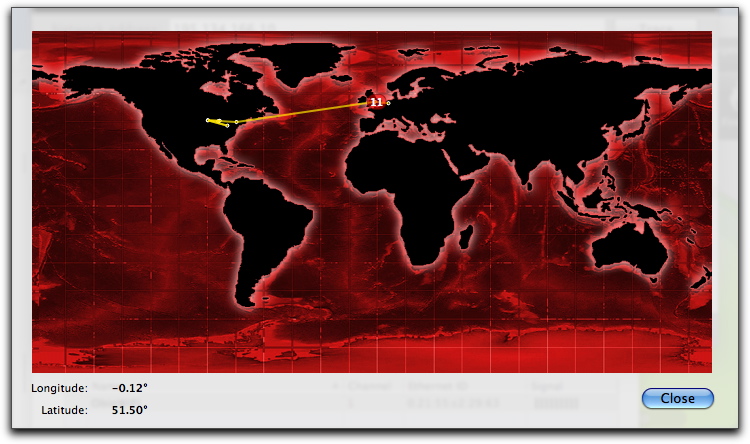
If you click the Google Earth button in the bottom-left corner, and you have Google Earth software installed on your Mac, VirusBarrier X6 will open Google Earth and zoom to the precise geographical location of the IP address.

Note that this will not work with addresses on your local network, and it will not work with all IP addresses.