Using Intego VirusBarrier Server 3
Logs
and Monitoring Tools
VirusBarrier Server 3 contains logs and monitoring tools to help you see which actions the program has carried out on malware, to record network activity and intrusion attempts, and to give you an overview of your server's activity in real time.
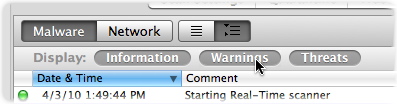
The Logs window displays two buttons at the top-left: Malware and Network. View either of these two logs by clicking the appropriate button.
The Malware Log
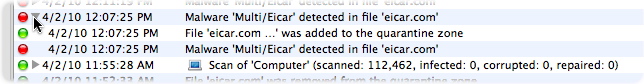
The malware log shows a record of malware activity that VirusBarrier Server 3 has observed, including all manual and scheduled scans and the results of these scans. As with the network log, you can filter it to highlight issues of interest.
To access the malware log, click the Malware button.
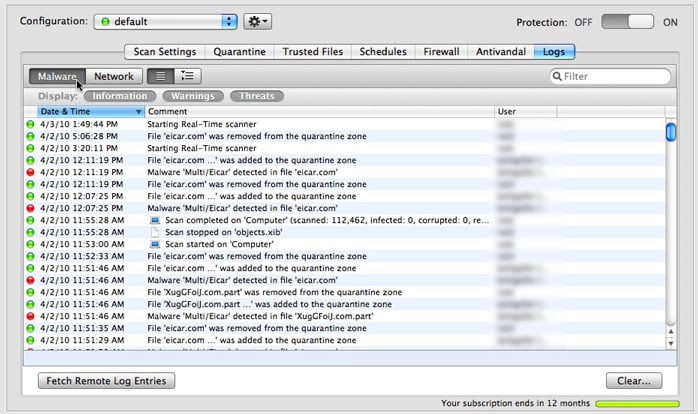
There are two ways you can display log information. In the example above, log entries are shown in linear order, each one taking up one line. You can click the second button at the top-left of the window and display log entries in hierarchical order, where disclosure triangles group related entries.
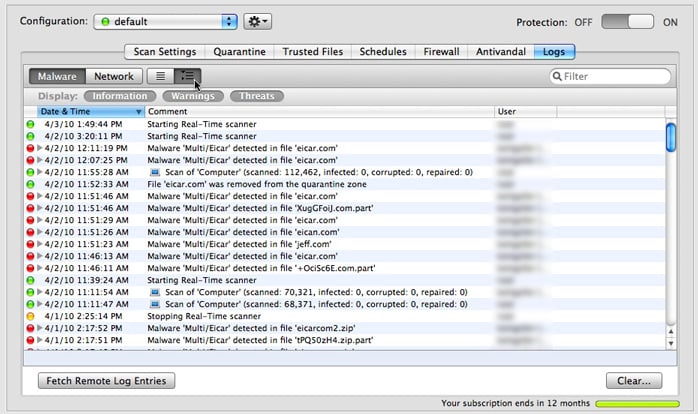
Clicking a disclosure triangle reveals related entries.
The Log shows every time that:
- You start a scan
- You cancel a scan in mid-process
- You start or stop the real-time scanner
- VirusBarrier Server 3 finishes a scan, with its results
- VirusBarrier Server 3 discovers a virus
- VirusBarrier Server 3 discovers a corrupted file
- VirusBarrier Server 3 repairs an infected file
- Files are added to or removed from the Quarantine Zone
- Files are added to or removed from the Trusted Files list
- Virus definitions are updated
The colored dots in the leftmost column show you what types of entries are displayed in the log. Green dots indicate information, such as starting the real-time scanner or updating virus definitions. Orange dots are for warnings, such as stopping the real-time scanner. Red dots indicate threats, such as when infected or corrupted files are found. The files, folders or volumes selected for each scan are named, as are all problems found.
You can choose to only display certain types of information by clicking one of the three log type buttons to hide or display their entries.
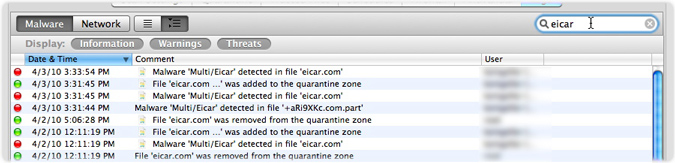
You can filter search results by entering text in the search field in the window's toolbar. As you type text, the results will narrow down, showing only those log entries that contain the text you have typed.
The Network Log
The network log shows a record of all network activity that VirusBarrier Server 3 has observed, as well as all intrusion attempts that VirusBarrier Server 3 has blocked. You can apply filters to it on several criteria to highlight issues of interest.
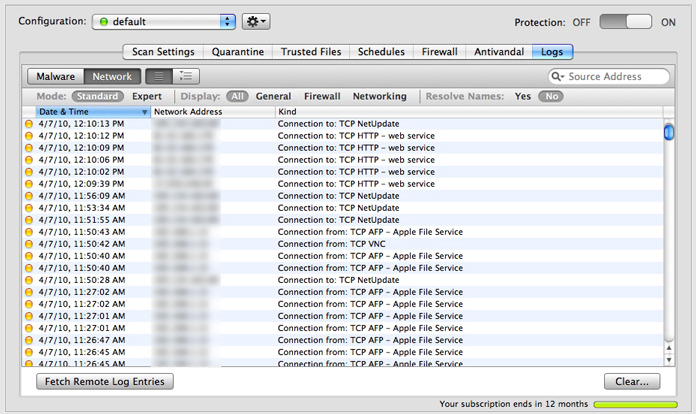
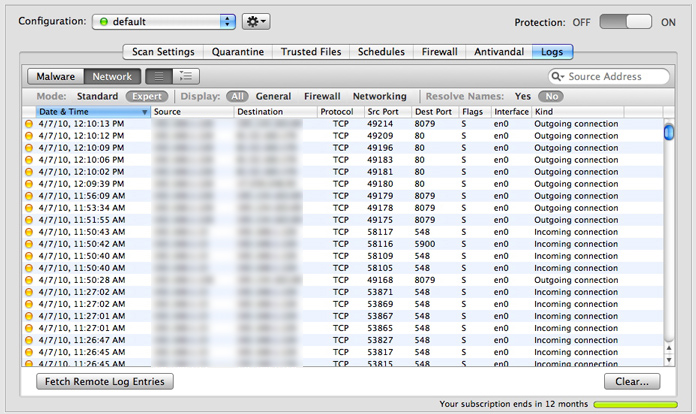
Click the Network button to display the network log window, then click Fetch Remote Log Entries to tell VirusBarrier Server Admin to retrieve log entries for the currently selected server.
The top of the log window contains three groups of options that affect how the log appears.
- The Mode group toggles between the default Standard view and an extended Expert view;
- The Display group shows subsets of log activity to help you see potential issues more clearly;
- The Resolve Names group lets you choose whether to view raw IP addresses or domain names using DNS lookup.
We'll examine each of these sets of options separately.
Network Log Modes
Standard mode (shown above) is the default for the Log screen. This displays only four pieces of information for each Log entry:
- Type of activity, indicated by dot color:
- Green: Informational entry.
- Yellow: Notable event, such as an outgoing connection, incorrect login, blocked outgoing data, etc.
- Red: Network attack, blocking of address in the Blocked Addresses list, Anti-Spyware blocking, etc.
- Date & Time of activity, according to your server's clock setting.
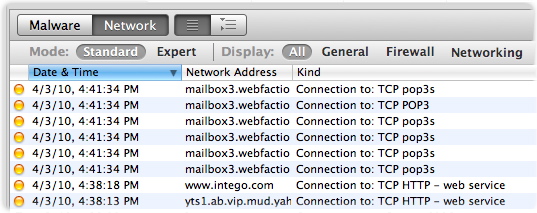
- Network Address, given by default as an IP address. If you've checked Resolve Names (see below), you'll see the domain names for those addresses that VirusBarrier Server 3 was able to resolve.
- Kind, a short description of the activity.
Expert mode gives an extended view, showing the following additional fields where applicable.
- Source, which is the originating IP address (or domain) of the incident. For most activities, the source will be your server's IP address, although for attacks or other incoming connections it will be that of the remote computer. If you have checked Resolve Names, you will see the domain names for those addresses that VirusBarrier Server 3 was able to resolve.
- Destination, given by default as an IP address.
- Protocol, which describes how the connection was attempted, i.e. TCP, UDP, ICMP or IGMP.
- Source Port, the port from which data was sent.
- Destination Port, the intended port for the data.
- Flags, or TCP flags, A (acknowledge), S (synchronize), F (end of data), or R (reset).
- Interface, the network interface used to send the data, such as Ethernet or AirPort, given by BSD Name.
- Kind, a short description of the activity.
Displaying Subsets of the Network Log
The Display section categorizes activities in three groups: General, Firewall and Networking. You can choose to see activities relating to all the groups at once, or only activities relating to a specific one. Click one of the buttons to change the log view.

- All: All activity that VirusBarrier Server 3 tracks. This is the default setting.
- General: Activity related to the operation of VirusBarrier Server 3 itself, such as instances when you launched and quit the program, entered items into the Blocked Addresses or Trusted Addresses list, and so forth.
- Firewall: Incidents when network activity triggered a firewall rule, if logging was turned on for that rule. Records of any Trojan horse attacks also appear in the Log, if you've turned on Trojan protection.
- Networking: All connections to networks or the Internet, and when IP addresses in the Blocked Addresses list attempt to connect to your computer.
Resolving Domain Names in the Network Log
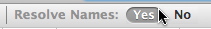
The Resolve Names section of VirusBarrier Server 3 helps you track down intruders by resolving the domain names of your connections. When Resolve Names is checked in the Log panel, VirusBarrier Server 3 will attempt to find the names for each of the Internet addresses shown in the log. If VirusBarrier Server 3 can find this information, it then displays it in name form rather than as numbers.
VirusBarrier Server 3 is not able to resolve the names of all Internet addresses, since some addresses have no name equivalents.
Filtering Data in the Network Log Window
At the top of the log window toolbar is a search field that lets you filter data according to several criteria, displaying only those entries that contain the selected criteria in the following categories:
- Source address
- Destination address
- Source port
- Destination port
- Interface
- Protocol
Source Address is the default criterion, as the search field shows.

To search for log data containing any of these criteria, click the disclosure triangle next to the Search icon.
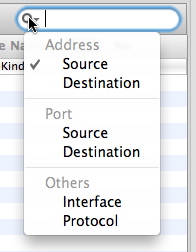
Select the criterion you want to search for, then enter a string in the search field. You don't need to enter the entire string; the display is dynamic, and automatically narrows down log data as you enter characters in the search field.
Clearing Logs
To clear either the Malware or Network log, and erase all information it contains, click the Clear... button in the lower-right corner. A dialog appears, asking you to confirm your request.
VirusBarrier Traffic Monitor
The VirusBarrier Server 3 installer also places an application called VirusBarrier Traffic Monitor in your Applications folder. You can launch this program by double-clicking its icon, or from the Intego Menu by choosing VirusBarrier Server 3 > Open VirusBarrier Traffic Monitor.
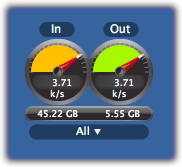
The VirusBarrier Traffic Monitor application provides a small, floating window that lets you keep an eye on network activity at all times. You can move this window location by clicking it and dragging to a new place on your screen.
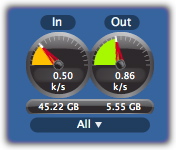
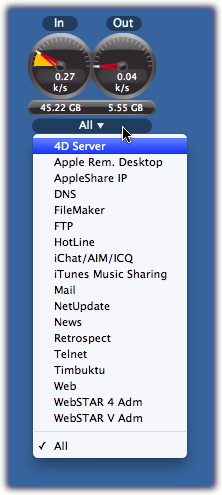
By default, VirusBarrier Traffic Monitor displays the total network traffic for all services. You can change what kind of traffic is displayed by clicking All at the bottom of the VirusBarrier Traffic Monitor window, and selecting a service from the popup menu.
Right-clicking anywhere in the VirusBarrier Traffic Monitor window offers you the option to put the gauge in Mac OS X's Dock. While there, the activity gauges continue to show you network traffic in real time.
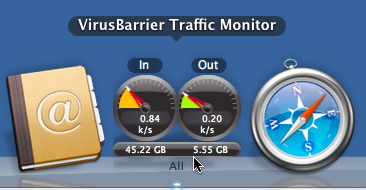
Network activity also appears in the VirusBarrier Traffic Monitor icon you see when you switch among applications by pressing Command-Tab.
To return VirusBarrier Traffic Monitor to its window, right-click on the VirusBarrier Traffic Monitor Dock icon, and choose Show in Window.
When VirusBarrier Traffic Monitor displays in the Dock, you can change its display by right-clicking on its Dock icon, and selecting a different service from its Dock menu.
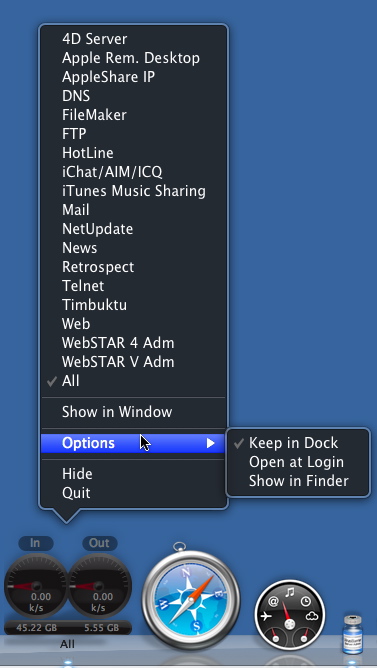
The Keep in Dock selection makes the VirusBarrier Traffic Monitor icon a permanent fixture in the Dock, even when the program is not running, so you can open it just by clicking its Dock icon. The Open at Login selection starts the program each time you start a user's session on your server.
VirusBarrier Traffic Monitor Preferences
Several preference settings affect the behavior of VirusBarrier Traffic Monitor. To set them, go to VirusBarrier Traffic Monitor > Preferences or press Command-comma while VirusBarrier Traffic Monitor is running.
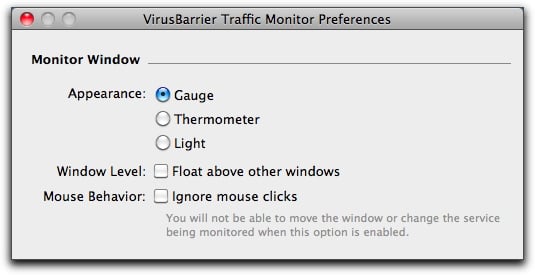
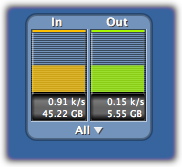
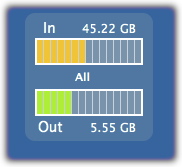
- Appearance: Choose from Gauge, Thermometer or Light:
- Window Level: Float above other windows makes VirusBarrier Traffic Monitor always appear in the foreground, above all other applications.
- Mouse Behavior: Ignore mouse clicks prevents you from moving VirusBarrier Traffic Monitor's window or changing the service it monitors.
The VirusBarrier Traffic Monitor Widget
VirusBarrier Server 3 installs the VirusBarrier Traffic Monitor widget that loads into Mac OS X's Dashboard to show you network activity when you are in Dashboard.
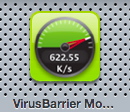
To display the VirusBarrier Traffic Monitor widget, activate Dashboard. Click the + button to display all the widgets available on your computer. Select VirusBarrier Traffic Monitor from the list. Its icon looks like this:
If you add it to your active widgets, you will see VirusBarrier Traffic Monitor whenever you switch to Dashboard. As with the VirusBarrier Traffic Monitor application, you can move the window or change the type of activity displayed.
The VirusBarrier Server 3 Traffic Monitor Screen Saver
VirusBarrier Server 3 installs a screen saver that gives you an overview of network activity when your computer is otherwise idle. In addition, if your Macintosh is running as a server, you can use this screen saver to keep an eye on its network activity.
To use the VirusBarrier Server 3 screen saver, open the System Preferences from the Apple menu, click on Desktop & Screen Saver, and click the Screen Saver tab. Select VirusBarrierSaver in the screen saver list.
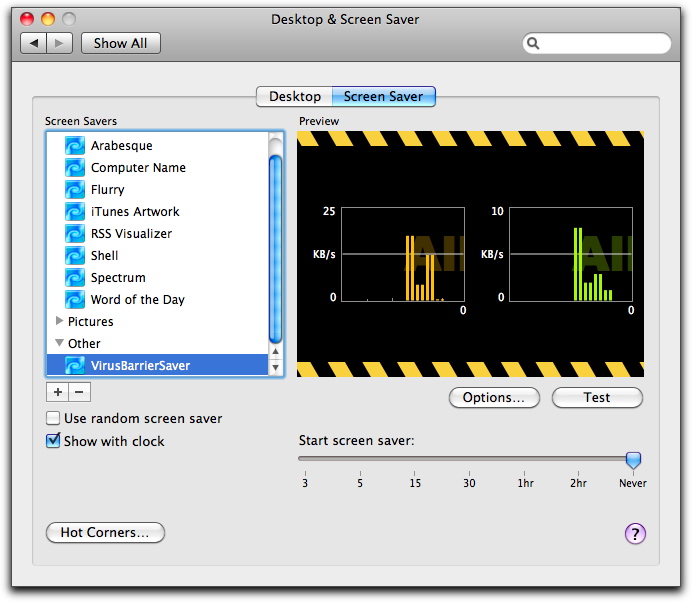
The preview screen only shows all traffic; however, it will show traffic broken down by service when actually running. Click Options to choose the order in which services are displayed.

Drag them into the order you want. The number of services displayed depends on your screen resolution and the number of screens you have: therefore, the ones most important to you should be listed first.
For more on screen saver settings, see the Mac OS X help.